
It’s kind of silly that we’re even calling what went on Friday and over the weekend a “sell-off”, but that’s just indicative of how spoiled we’ve gotten by the absence of normal volatility this summer.
But summer is gone, like the headphone jack, and September is getting underway in a manner quite true to its volatile reputation.
So anyway, what’s do we make of this sell-off, shallow though it’s been so far? I turn to some of my favorite technicians this morning…
First, Ari Wald at Oppenheimer, who sees it as a buying opportunity. Ari notes that yields could back up on the 10-year to 1.8, 1.9% and still not present a problem for the equity market. The Taper Tantrum in 2013 is a good analog for this – stock volatility after Bernanke’s hawkish warning presented a fantastic chance to get long. He also notes that the Put/Call ratio is flashing a tactical buy signal, as well as the Vix spike.
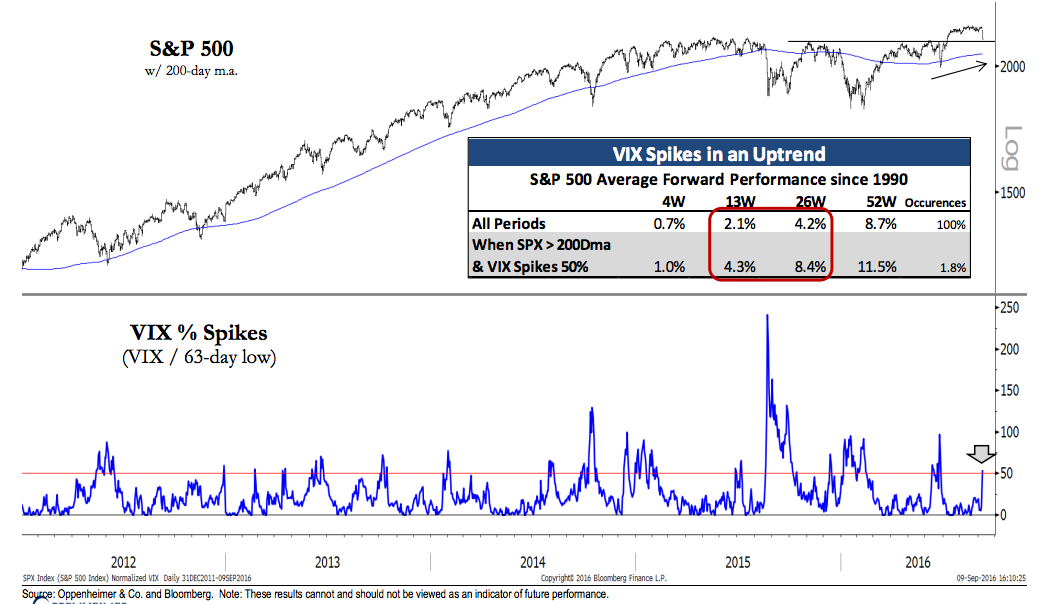
Here’s Ari on what a Vix spike in the context of an uptrending stock market portends:
The recent spike in the VIX has also reached a buyable threshold, by our analysis. We define a VIX spike as a reading that is 50% higher than its 63-day low; this helps normalize for different volatility environments, and we consider the S&P 500 in an uptrend when the index is above its 200-day m.a. Spikes in the VIX typically occur around short-term market lows, and we’ve found it’s a more compelling signal when trend is positive. Since 1990, the S&P 500 has averaged an 8.4% gain in the next six months when this signal of selling exhaustion is triggered vs. a 4.2% gain during any six-month period.
You may click to embiggen his chart:
Next, Jon Krinsky at MKM, no stranger to regular readers here. Jon sees Friday’s action as a fumble in the proverbial red zone. Just when the bulls thought they had it all sewn up for 2016…
The Bulls were driving down the field, looking to close the door heading into the fourth quarter. And then came Friday’s fumble, letting the Bears back into the game. After not suffering a 1% daily decline in over two months, the S&P 500 lost 2.45% on Friday, its worst day since the ‘Brexit.’ The question now becomes, does one day change the trend? In the short term, the break below initial support at 2155 on the heaviest distribution day in a year is clearly a set-back for the Bulls. Further, markets rarely bottom on a Friday, so some further weakness toward the 2110 area would not be surprising at this point. However, with 71% of the SPX still above its 200 DMA, high beta outperforming low volatility, and a 97% down volume day now behind us, we still think Bulls win the game.
Jon goes on to note that Friday’s “97% down day” – during which 97% of the volume on the NYSE occurred in stocks that were lower – represents the single biggest distribution day since September 2015. Since 2010, 11 of the last 14 such distribution days have seen the S&P 500 trading higher 3o days out.
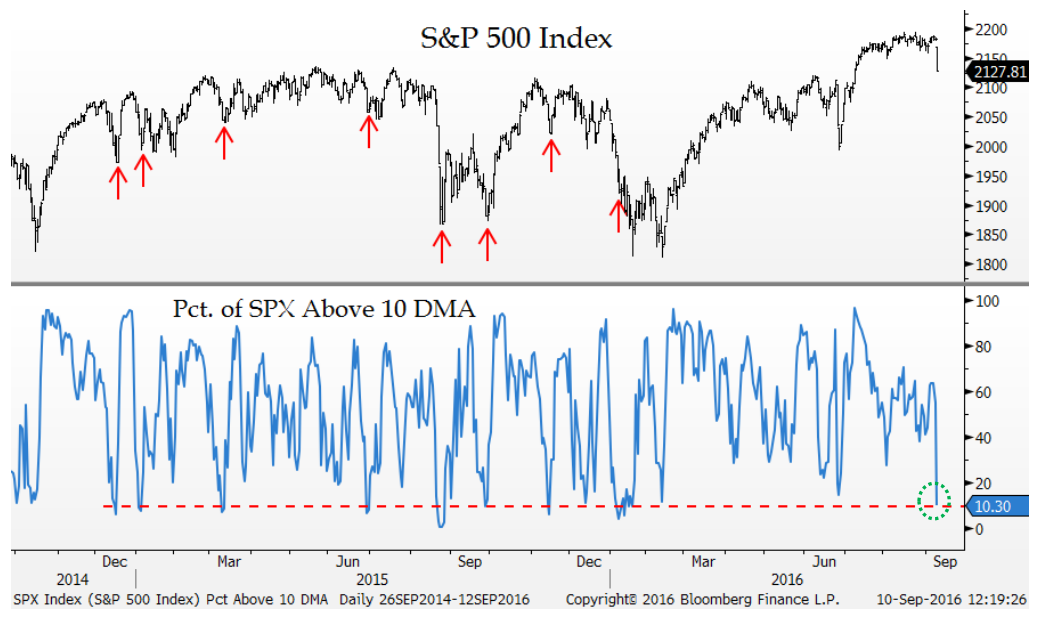
Further, we’ve already seen a washout in the percentage of SPX names trading above their ultra-short-term 10-day moving averages – down to just 10.3%, the lowest reading since January. Here’s what that looks like:
Finally, let’s check in with Bank of America Merrill Lynch’s technical ace Stephen Suttmeier…
Stephen is somewhat constructive given support for the S&P 500 in the form of rising weekly moving averages and notes that what we’re seeing now is merely a test of the July breakout.
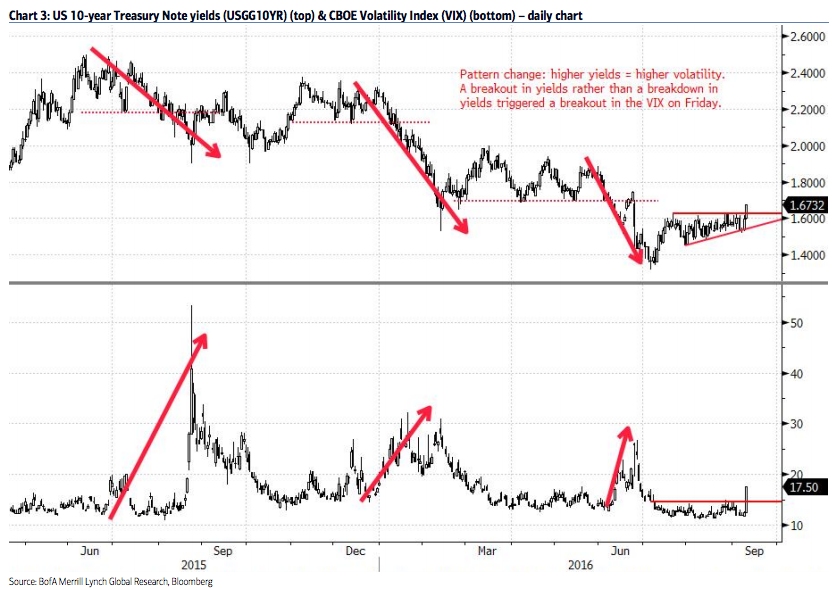
But he notes an interesting pattern change worth discussing. For a long time now, rising stock volatility has led to declining yields, as the fearful were reaching for Treasurys in times of distress. Not anymore. Now, it appears rising yields and stock volatility are a newly correlating pair…
Higher yields = higher volatility
Pattern change: higher yields = higher volatility Friday’s breakout in US 10-year T-note yields coincided with an upside breakout in the CBOE Volatility Index (VIX). Higher yields and higher volatility is a pattern change as recent upward spikes in the VIX prior to last week were associated with sharp declines in US 10-year yields rather than a sharp rise in yields
Have a look at Suttmeier’s yields vs Vix chart below (click to embiggen):
Josh here – Stephen reminds us that the Brexit Vix spike this summer peaked out at 26.72 while the “world is coming to end” Vix spike from January / February got up to 30.90. Comparably speaking, today’s high-teens number could still have a ways to go.
Never a dull moment (for too long).
Sources:
Technical Analysis: Inflection Points
Oppenheimer – September 11th, 2016
A Fumble in the Red Zone
MKM partners – September 11th, 2016
Tactical breakdown on a complacent 90% down day as higher yields = higher VIX
Bank of America Merrill Lynch – September 11th, 2016


… [Trackback]
[…] Information to that Topic: thereformedbroker.com/2016/09/12/global-sell-off-technicians-weigh-in/ […]
… [Trackback]
[…] Find More to that Topic: thereformedbroker.com/2016/09/12/global-sell-off-technicians-weigh-in/ […]