
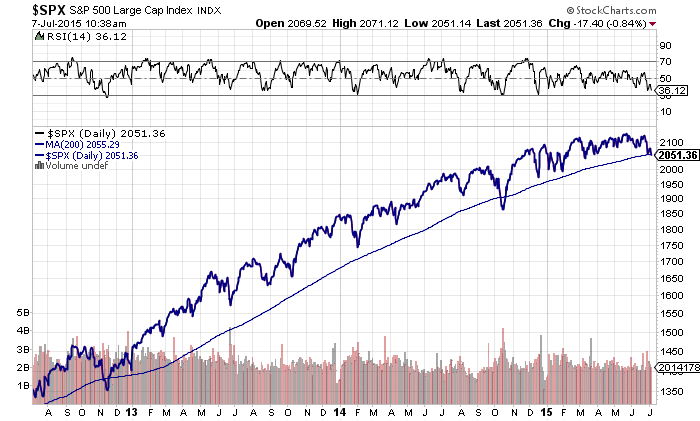
The S&P 500 has taken out its 200-day moving average to the downside on an intra-day basis as of this writing. The index finished out last month just above this key level of supply/demand by pennies, but we’ve been flirting with it all year as stocks have gone nowhere and the trendlines have flattened. As you can see in my above chart, RSI is “confirming” which means momentum is dropping right in line with price itself.
You can also see that this descent below the 200-day is not a frequent occurrence in today’s stock market.
This matters and it doesn’t matter. Let me explain.
It doesn’t matter because you could just pick another trend line and say we’re above it arbitrarily – say, the 250-day for example. Show me, in the holy papyrus scrolls, where it indicates God prefers the 200-day to all other moving averages? Also, anything as closely watched – by both traders and the financial media – as the 200-day simple moving average (SMA) couldn’t possibly represent a truly actionable signal, almost by definition. When have you ever made money by paying attention to a metric that a child could follow? Could you do it twice? Thrice?
It does matter, however, because a lot of other people believe it matters – the Keynesian Beauty Contest. If the other judges, whose money flows move the market, begin to behave differently as a result of something like a 200-day crossover, then it de facto does matter – to the degree that others believe it does.
Further, the research we’ve done in-house indicates that a majority of nasty market events have taken place whilst the stock market was below this trendline when you look back through history. As my firm’s director of research, Michael Batnick, showed last week, “Since 1960, 22 of the 25 worst days have occurred below the 200-day moving average. Of the 100 worst single days over the last 55 years, 83 of them happened while stocks were below the 200-day.”
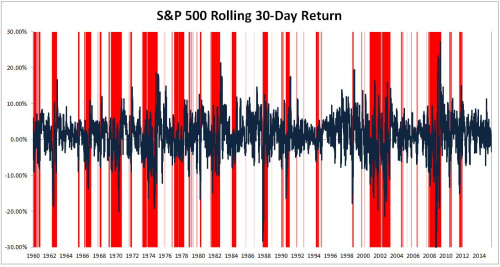
You can see this below, as manifested by rolling 30-day period returns. Stocks do significantly worse on average, over the course of a month, while the S&P 500 trades below its 200-day. The data, via Batnick:
The chart below shows the rolling thirty-day return for the S&P 500. Areas highlighted in red are when stocks are below the 200-day. What you’ll notice is that this is where the vast majority of negative spikes occurred. The average 30-day return going back to 1960 is 0.88%. The average 30-day return when stocks are below the 200-day is -2.60%.
Josh here – there’s nothing controversial about what we’re saying here. The positive feedback loop gets interrupted when the predominant trend flattens out or turns lower. This leads to an increase in nervousness and the heightened potential for real corrections. Which stupid news announcement serves as the correction’s catalyst is beside the point. You’ll not be able to guess at it ahead of time. The last one was Ebola in Houston. You can’t make this stuff up.
Fortunately, there are not large pools of assets being run tactically based on 200-day moving averages. This means that the magnitude of any kind of forced or rules-based selling is likely limited as a result of the occurrence. Additionally, the two previous instances in which the S&P 500’s 200-day was meaningfully breached – October 2012 and October 2014, essentially acted as a catharsis of sorts – almost like a reset for the uptrend.
One last thing – we’re talking about an intra-day violation of the 200-day so far. Not even a weekly or a monthly close below it. There’s a big difference. Daily occurrences are noisier than weekly ones which are noisier than monthly ones, etc. If you’re reacting to each day’s technical signals with trades or changes to your allocation, you’re going to need a second job to pay for the commissions, taxes and therapy sessions.
The question to ask yourself, if you respect price and trend in any way whatsoever, is whether or not the 2011-2015 bull market deserves the benefit of the doubt.
Source:
What You Need to Know About the 200-Day Moving Average (Irrelevant Investor)
We literally do this stuff for a living. If we can help you with your portfolio or financial plan in any way, feel free to reach out:


… [Trackback]
[…] There you will find 53823 more Information on that Topic: thereformedbroker.com/2015/07/07/were-below-the-sp-500s-200-day-moving-average/ […]