The Merrill Lynch RIC team sees a slow and low hiking cycle on the horizon, with a Fed Funds rate still under 2% by the end of 2016.
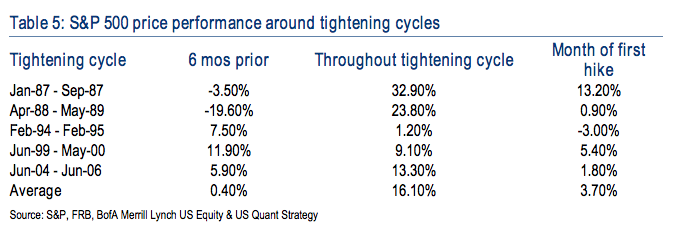
Below, some data on how stocks have behaved before and during recent tightening cycles. You’ll note that historically it’s the six months leading into the hike where equities had been more “at risk” as opposed to during the actual tightening periods:
After analyzing several recent Fed tightening cycles, our US equity strategists find that the stock market has done well during tightening cycles, with average returns of around 16%. When long-term rates have risen from low levels, stocks have done particularly well. The best returns for the S&P 500 (average of 24% annualized) have occurred when rates were 2-3% but rising. Risks to equities appear more pronounced in the six months leading up to the first rate hike (Table 5).
Josh here – another key takeaway is that, during each of these cycles, there were too many unique factors for a reasonable person to be able to conclude that this will be just like 1988 or the current situation is setting up another 2004. It’s just not that simple. Historical examples only give us a sense of the possibilities, given all the non-interest rate variables (valuation, geopolitics, economic conditions, tax rates, demographics, etc) that affect financial asset prices.
I took a deeper dive into the topic of stocks vs rates in my piece at Fortune, which you can read here:
I’m a New York City-based financial advisor at Ritholtz Wealth Management LLC. I help people invest and manage portfolios for them. For disclosure information please see here.
Subscribe & Reform
Get a Full Investor Curriculum: Join The Book List
Every month you'll receive 3-4 book suggestions--chosen by hand from more than 1,000 books. You'll also receive an extensive curriculum (books, articles, papers, videos) in PDF form right away.


The S&P 500 vs Recent Tightening Cycles http://t.co/dxYOA62Mzw
RT @ReformedBroker: The S&P 500 vs Recent Tightening Cycles http://t.co/dxYOA62Mzw
The S&P 500 vs Recent Tightening Cycles http://t.co/Y31eMnqV1H
RT @ReformedBroker: The S&P 500 vs Recent Tightening Cycles http://t.co/dxYOA62Mzw
RT @ReformedBroker: The S&P 500 vs Recent Tightening Cycles http://t.co/dxYOA62Mzw
RT @ReformedBroker: The S&P 500 vs Recent Tightening Cycles http://t.co/dxYOA62Mzw
The S&P 500 vs Recent Tightening Cycles: @ReformedBroker http://t.co/SF7j7NT8pR http://t.co/vqBNp2yrei
RT @wonkmonk_: The S&P 500 vs Recent Tightening Cycles: @ReformedBroker http://t.co/SF7j7NT8pR http://t.co/vqBNp2yrei
Acerca de la tan temida subida de tipos USA y el SP 500 http://t.co/aLexj3d2aw http://t.co/cFTqUf6PwT
RT @ReformedBroker: The S&P 500 vs Recent Tightening Cycles http://t.co/dxYOA62Mzw
RT @ReformedBroker: The S&P 500 vs Recent Tightening Cycles http://t.co/dxYOA62Mzw
RT @wonkmonk_: The S&P 500 vs Recent Tightening Cycles: @ReformedBroker http://t.co/SF7j7NT8pR http://t.co/vqBNp2yrei
How stocks behave before and during ‘tightening cycles’ @ReformedBroker http://t.co/MBnOzMTHJx
RT @asibiza1: How stocks behave before and during ‘tightening cycles’ @ReformedBroker http://t.co/MBnOzMTHJx
RT @asibiza1: How stocks behave before and during ‘tightening cycles’ @ReformedBroker http://t.co/MBnOzMTHJx