
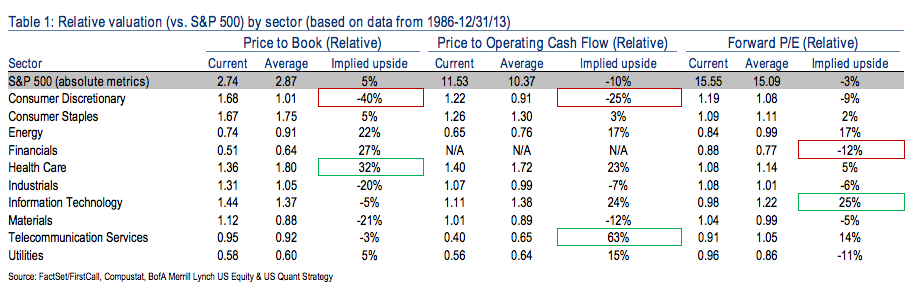
As the market has run up, several sectors have gotten historically expensive (we’re looking at you, Consumer Discretionary) but others have trailed the overall market’s normalization and now sell at a discount to their historical averages. Surprisingly, you’ll find the Technology sector at the top of the list in terms of its price to 2014 earnings estimates; it’s current multiple on that measure is 25% lower than that of the total market!
Here’s Savita Subramanian of Bank of America Merrill Lynch’s US Equity and Quant Strategy team:
Tech and Energy remain the two most inexpensive sectors vs. history on relative forward P/E, with all of their component industries offering implied upside vs. historical average multiples. We expect that as global growth picks up over the next several quarters, multiples should expand for these sectors. We saw evidence of this in December, as all six cyclical sectors in the S&P 5000 saw their forward P/Es expand, led by Tech and Industrials.
… and their chart of all sectors vs the S&P 500, now and historically, on three valuation metrics:
(click to embiggen!)
Source:
Market has normalized, but sectors still in progress (January 15th 2014)
Bank of America Merrill Lynch


… [Trackback]
[…] Read More on to that Topic: thereformedbroker.com/2014/01/21/chart-o-the-day-sp-500-relative-value-by-sector/ […]
… [Trackback]
[…] Information to that Topic: thereformedbroker.com/2014/01/21/chart-o-the-day-sp-500-relative-value-by-sector/ […]
… [Trackback]
[…] Find More to that Topic: thereformedbroker.com/2014/01/21/chart-o-the-day-sp-500-relative-value-by-sector/ […]
… [Trackback]
[…] Here you will find 86932 more Info to that Topic: thereformedbroker.com/2014/01/21/chart-o-the-day-sp-500-relative-value-by-sector/ […]
… [Trackback]
[…] There you can find 88919 additional Information on that Topic: thereformedbroker.com/2014/01/21/chart-o-the-day-sp-500-relative-value-by-sector/ […]
… [Trackback]
[…] Read More to that Topic: thereformedbroker.com/2014/01/21/chart-o-the-day-sp-500-relative-value-by-sector/ […]
… [Trackback]
[…] Read More on to that Topic: thereformedbroker.com/2014/01/21/chart-o-the-day-sp-500-relative-value-by-sector/ […]
… [Trackback]
[…] There you can find 36552 additional Info to that Topic: thereformedbroker.com/2014/01/21/chart-o-the-day-sp-500-relative-value-by-sector/ […]
… [Trackback]
[…] Read More Info here on that Topic: thereformedbroker.com/2014/01/21/chart-o-the-day-sp-500-relative-value-by-sector/ […]
… [Trackback]
[…] There you will find 5470 more Information to that Topic: thereformedbroker.com/2014/01/21/chart-o-the-day-sp-500-relative-value-by-sector/ […]
… [Trackback]
[…] Info on that Topic: thereformedbroker.com/2014/01/21/chart-o-the-day-sp-500-relative-value-by-sector/ […]