We have a tendency in trading to discuss whether or not a market is a buy or sell on its own merits – or on an absolute basis, if you will. But in asset management and portfolio construction, the issue is framed differently. Instead, we’re thinking about asset classes and geographies relative to each other.
In other words, “if I only have one hundred dollars, how many dollars do I keep in one bucket versus another more attractive bucket?”
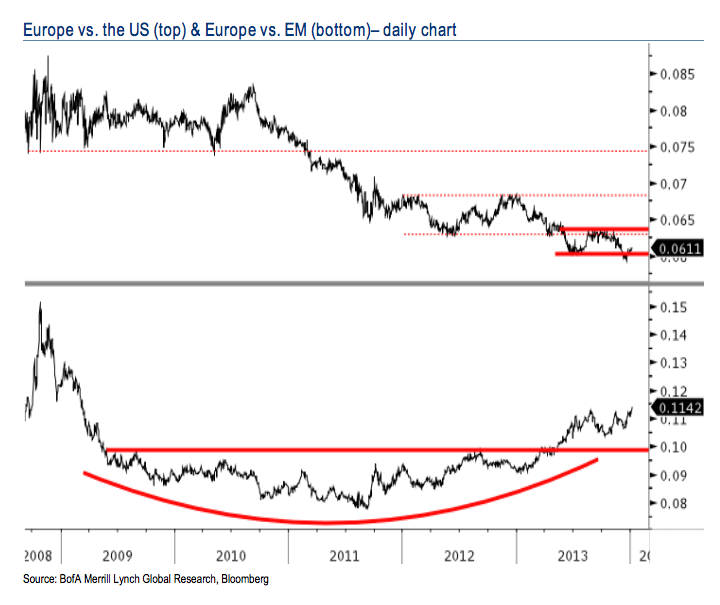
Here’s Stephen Suttmeier, CFA, CMT, making the technical case for Europe versus Emerging Markets and then versus the US. In the case of Europe vs EM, the breakout is already in progress. But with Europe vs the US, we may just be seeing the bottom finally after years of outperformance…
Europe is breaking from a bullish consolidation relative to EM. This follows a breakout for Europe from a four-year bottom relative to EM and sets up Europe for longer-term
outperformance vs. EM – look to buy dips or consolidations in the relative ratio for Europe vs. EM. MSCI Europe remains in a downtrend vs. the US but is showing signs of a relative double bottom vs. the US – stay tuned.
Josh here, pay particular attention to the top pane (MSCI Europe vs US stocks). If that trend is truly drying up and poised to come back the other way, there’s a big opportunity there on a relative basis (we’ve already discussed the fundamental and valuation discrepancies here many times).
Source:
Monthly chart portfolio of global markets (Market Analysis, January 7th 2014) Bank of America Merrill Lynch
[…] There you will find 82477 additional Info to that Topic: thereformedbroker.com/2014/01/09/chart-o-the-day-a-technical-case-for-european-stocks/ […]
[…] Here you can find 12272 additional Information to that Topic: thereformedbroker.com/2014/01/09/chart-o-the-day-a-technical-case-for-european-stocks/ […]
I’m a New York City-based financial advisor at Ritholtz Wealth Management LLC. I help people invest and manage portfolios for them. For disclosure information please see here.
Subscribe & Reform
Get a Full Investor Curriculum: Join The Book List
Every month you'll receive 3-4 book suggestions--chosen by hand from more than 1,000 books. You'll also receive an extensive curriculum (books, articles, papers, videos) in PDF form right away.


… [Trackback]
[…] Here you can find 63580 more Info on that Topic: thereformedbroker.com/2014/01/09/chart-o-the-day-a-technical-case-for-european-stocks/ […]
… [Trackback]
[…] There you can find 7982 more Information to that Topic: thereformedbroker.com/2014/01/09/chart-o-the-day-a-technical-case-for-european-stocks/ […]
… [Trackback]
[…] There you will find 82477 additional Info to that Topic: thereformedbroker.com/2014/01/09/chart-o-the-day-a-technical-case-for-european-stocks/ […]
… [Trackback]
[…] Info to that Topic: thereformedbroker.com/2014/01/09/chart-o-the-day-a-technical-case-for-european-stocks/ […]
… [Trackback]
[…] Info on that Topic: thereformedbroker.com/2014/01/09/chart-o-the-day-a-technical-case-for-european-stocks/ […]
… [Trackback]
[…] Here you can find 12272 additional Information to that Topic: thereformedbroker.com/2014/01/09/chart-o-the-day-a-technical-case-for-european-stocks/ […]
… [Trackback]
[…] Read More on to that Topic: thereformedbroker.com/2014/01/09/chart-o-the-day-a-technical-case-for-european-stocks/ […]
… [Trackback]
[…] Information to that Topic: thereformedbroker.com/2014/01/09/chart-o-the-day-a-technical-case-for-european-stocks/ […]
… [Trackback]
[…] Find More Information here on that Topic: thereformedbroker.com/2014/01/09/chart-o-the-day-a-technical-case-for-european-stocks/ […]