It’s easy to poke fun at people who’ve been using valuation or some other fundamental indicator as a market timing signal. It’s demonstrably ridiculous and the results for the most stubborn among them have been disastrous.
Equally ridiculous is the idea that any one or two technical indicators can tell you when an uptrend or a downtrend is through running its course. We all have our favorite technical measures of price but, in the end, all of them are subservient to price itself.
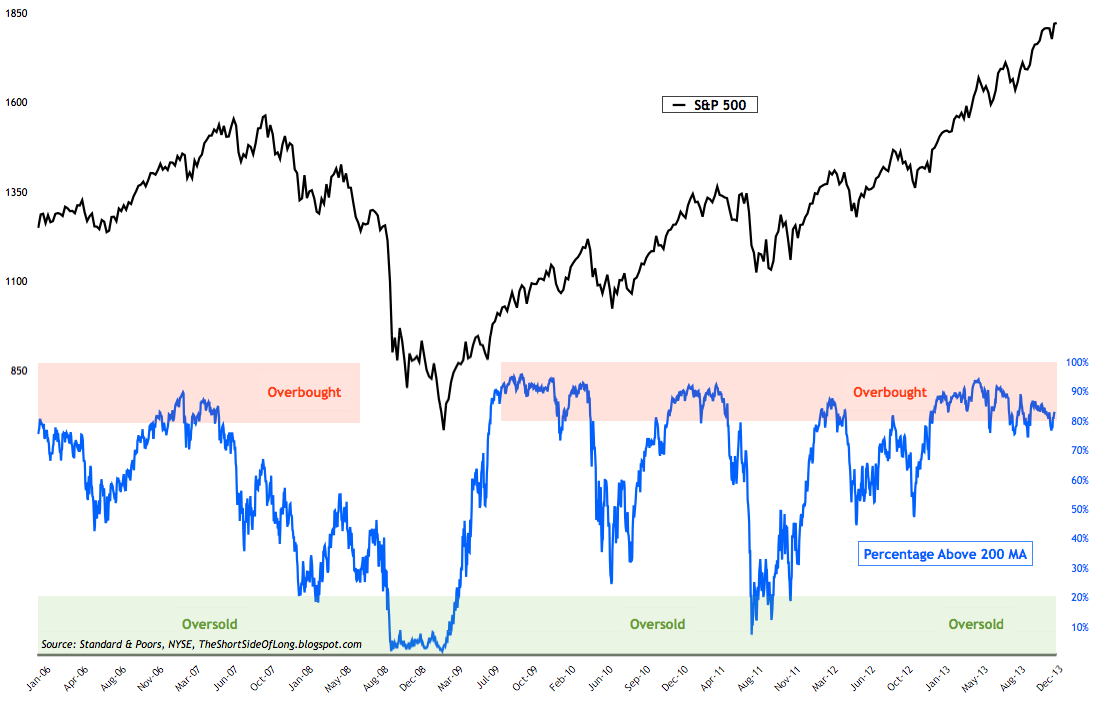
Here’s the blogger at The Short Side of Long with a look at the “overbought” nature of the stock market all year, which clearly can persist in not mattering for quite a long time. The percentage of stocks trading above their 200-day moving averages rose into “overbought” territory around 80% last October and stayed there pretty much all year:
Just a quick update on one of my favourite indicators for the stock market – percentage of stocks within the S&P 500 trading above the 200 day moving average. The indicator continues to flash a warning signal, something I have discussed on my blog for the last few months. So far the market has turned a cold shoulder to on going bearish divergence as it continues to tear higher into record territory.
Chart 2: The stock market has been overbought for the whole of 2013
Oh well.
The next time someone cites this or any other single indicator (fundamental or technical) to bolster their bull or bear case, be sure to reply with “So?” No signal operates in a vacuum and, as I like to say (perhaps too often), it’s not different this time – It’s different EVERY time.
Not all of the metrics you choose to follow are going to be telling the same story at once and some of your signals – even your preferred ones – can spend what feels like forever in the cosmic penalty box, mattering less than the price of tea in China.
I’m a New York City-based financial advisor at Ritholtz Wealth Management LLC. I help people invest and manage portfolios for them. For disclosure information please see here.
Subscribe & Reform
Get a Full Investor Curriculum: Join The Book List
Every month you'll receive 3-4 book suggestions--chosen by hand from more than 1,000 books. You'll also receive an extensive curriculum (books, articles, papers, videos) in PDF form right away.


… [Trackback]
[…] There you can find 89757 more Information to that Topic: thereformedbroker.com/2013/12/26/chart-o-the-day-overbought/ […]
… [Trackback]
[…] Find More to that Topic: thereformedbroker.com/2013/12/26/chart-o-the-day-overbought/ […]
… [Trackback]
[…] Here you can find 16297 additional Information to that Topic: thereformedbroker.com/2013/12/26/chart-o-the-day-overbought/ […]
… [Trackback]
[…] Find More here to that Topic: thereformedbroker.com/2013/12/26/chart-o-the-day-overbought/ […]
… [Trackback]
[…] Info on that Topic: thereformedbroker.com/2013/12/26/chart-o-the-day-overbought/ […]
… [Trackback]
[…] Read More to that Topic: thereformedbroker.com/2013/12/26/chart-o-the-day-overbought/ […]
… [Trackback]
[…] Read More Info here to that Topic: thereformedbroker.com/2013/12/26/chart-o-the-day-overbought/ […]
… [Trackback]
[…] Info to that Topic: thereformedbroker.com/2013/12/26/chart-o-the-day-overbought/ […]
… [Trackback]
[…] Read More Information here on that Topic: thereformedbroker.com/2013/12/26/chart-o-the-day-overbought/ […]